|
In my current district I feel like I have a unique and different approach to teaching mathematics. Whether it is because I am one of the ‘younger’ teachers or because I learned math through an integrated approach or because my love of math goes far beyond just the algorithms we teach to the beauty of it that appears in nature and the world around us I always try to bring interesting or different topics to my students about math as well so that hopefully their love of mathematics can grow. However, an area that I have always struggled to integrate an interesting or different approach is Data and Statistics. This week in my CEP 805 class I was able to give myself some time to improve my Specialized Content Knowledge (Hill & Ball 2009) in this area through the lens of social justice. This was truly eye opening for me as I’ve always wanted to integrate other subjects into my math classroom so that students can see that subjects have interconnections and are not just separate entities. It seems obvious that you could integrate science and math, but integrating something like social change or social awareness always seemed so difficult to me and I felt I would just have to leave that to the History and English teachers in my building. After investigating lesson plans on Dr. France’s Harpers site, solving world problems, that integrate data, probability, statistics and other mathematical concepts to promote social awareness and justice, I was so excited to borrow or modify these lessons and bring them to my classroom to share with my students. That being said, while these topics absolutely need to be taught to students, the current climate of education has me a bit worried about push back from administration, parents, and students. Being married to an English teacher who teaches kids social awareness through the lens of empathy for others on a daily basis I see the stress and worry that it brings him. But if the focus is instead that “culturally relevant pedagogues understand that their job is not to make students think like they think, but rather to have them think” (Clark 2021, p27) then I don't think there could be much room for people to complain. After seeing ways that I can integrate social awareness into my mathematics lessons and reading about why it is so important that underrepresented groups are seen and heard in all subject areas I feel more confident to tackle these important issues. While looking for lessons that integrate social justice and mathematics I found ways to improve my Knowledge of Content and Teaching (Hill & Ball 2009) through sites like PBS Learning Media and the always amazing YouCubed. Resources:
Hill, H., & Ball, D. L. (2009). The curious - and crucial - case of Mathematical Knowledge for Teaching. Phi Delta Kappan, 91(2), 68–71. Clark, C. P. (2021). An opportunity or change: Groundbreaking scholar Gloria Ladson-Billings on culturally relevant pedagogy and why education as we know it needs to be transformed. Literacy Today, 38(5), 24–27.
0 Comments
Last year when the world had to lock down because of the global pandemic I know a lot of teachers felt extremely overwhelmed and concerned as to how to help students engage with math digitally, and I did too, but I also love a challenge because I believe they help you grow as a person and educator. Last year I tried a lot of different technologies to help my students engage with math in a meaningful way and once I found a few I liked I stuck with those. However, after a year of playing with a bunch of different technologies - desmos, FlipGrid, PearDeck, Kami, GeoGebra, the Google suite, quizlet, blooket, etc - I now have so many tools to pick from if I want to present material in person in a new or different way. FlipGrid in particular surprised me in its usefulness in a math classroom. FlipGrid integrates with a lot of platforms, so I was easily able to link it to my google classroom, and it allows students to post short videos to share out with the entire class, or only me. I only used FlipGrid once during our virtual school year last year, in part because my first and only attempt I felt was a bit of a failure. I wanted to hear my students talking about math, so I came up with five different questions that they had to answer out loud and they could show their work on a piece of paper in the video as well. And while my students did an excellent job and it was wonderful to see and hear my students talking about math, it was a bit uninspired and overwhelming of a task for some. Since then, and after brainstorming with my amazing classmates in my MSU CEP 805 course, I have had so many new ideas for how to implement FlipGrid in the classroom and I have even put them to use a few times this year. I had my algebra 1 students create their own ‘graphing stories’ videos and then watch their classmates and graph them on paper. Feel free to use this activity that I created for my students, inspired by the website - graphingstories.com 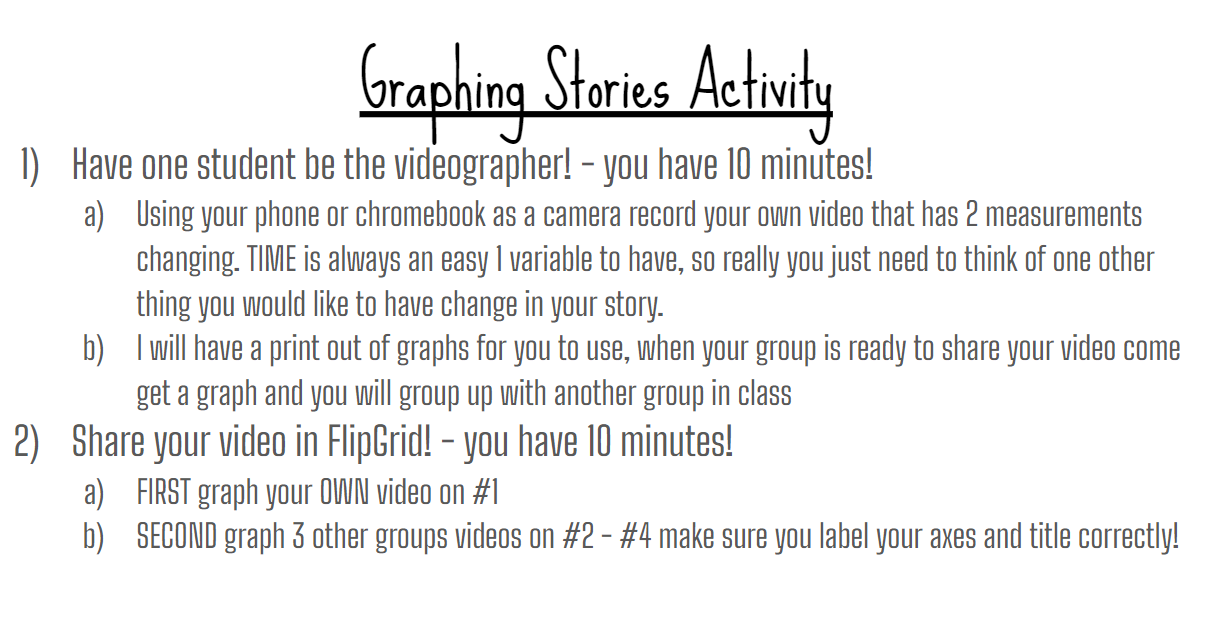 For our upcoming surface area and volume unit in geometry I will have students find objects at home to take pictures or videos of with a ruler so that we can find their measurements, or at least talk about how their measurements might be similar, different, or related. And finally a project I am working on currently for my algebra 2 students is one in which I will have them take video of rolling a pair of dice a number of times, pulling out a card from a standard deck a number of times, pulling candy out of a bag a number of times, etc. to simulate experimental probability that we can then watch everyone in class do this and find those probabilities. If you have other suggestions on how to implement FlipGrid in a math classroom, please comment below! While all these new ideas are exciting and fun to try, there is always the worry that a student may not have stable internet to do this at home, or the home life to feel safe in posting a video like this. You may have students who do not attend to the task at hand, or do not feel comfortable being on camera. Luckily building up trust in your classroom can alleviate some of these concerns and FlipGrid has emojis you can put over faces, or a blur feature if you do not want to be on camera. And luckily my school is fortunate enough to be one-to-one so each student has a Chromebook with a webcam, so as long as I provide some class time to complete the task usually it can get done. Resources:
Misura, M. (2021, October 10). Graphing Stories. [Image].
Something that I have struggled with throughout the course of my teaching career so far is how to accurately and fairly assess students' learning. In the traditional sense from what I have seen as a student, teacher, and heard from my colleagues who have been doing this longer than I have, the way to assess in a high school math classroom is half way through the chapter you take a quiz and at the end you take a test. These should never be multiple choice and students should absolutely use a calculator (or with specific skills they absolutely should NOT use a calculator). Students should always have a significant amount of homework to practice skills on their own daily and if they have questions they are responsible for asking for clarification during class, if time allows or if not, on their own time.
Ok, I’m exaggerating a bit - but not much! I am a very competitive person so proving myself on a test was always fun for me - but I know that that is not how everyone sees a test and research has taught us that not all students can perform well on these traditional style testing methods. You tend to teach how you were taught or how you best learn, so when I was first starting out as a teacher I did exactly the formula above (lots of homework, mid-chapter quiz, test). But after years of seeing students struggle to manage the workload, be successful on a traditional style test, and overall see the joy leave the room as I say ‘take everything aside from a pencil off your desk,' I had to start thinking of other ways to to assess my students learning for their sanity and my own.
This is something I am still struggling with year after year and this week I tried to put some work in to improve my Knowledge of Content and Students in regards to assessment (Hill & Ball 2009). Overall the goal is have students gain mastery and deep understanding of the content and one of the best ways to ensure this is happening is to use feedback to drive instruction (Humes 2021). How we go about doing this has been argued many different ways and managing thirty plus students per class period increases the difficulty of this as well. However, over the years I have introduced labs, projects, reduced the amount of homework I give, and have students take daily check in ‘quizzes’ to give me a guide as to how they are progressing through a unit.
One unit in geometry in particular lends itself to assessing outside the box in an obvious way to me - whenever we approached the idea of area, surface area, and volume I can think of numerous projects that students could engage with and actually talk about measurement in a real way. Bringing objects from home to physically measure and talk about, or finding things in the school, or creating origami to then find the surface area or volume helps to bring math and measurement to life. What I never had considered in terms of measurement, until diving deeper into the Common Core State Standards, is that probability is the core focus of measurement in the high school standards. Perhaps now is the time to admit another one of my weaknesses in my Specialized Content Knowledge area and give myself another perfect opportunity to increase that knowledge for the benefit of myself and my students (Hill & Ball 2009).
Resources:
Hill, H., & Ball, D. L. (2009). The curious - and crucial - case of Mathematical Knowledge for Teaching. Phi Delta Kappan, 91(2), 68–71. Humes, A. (2021). Formative assessment and technology in the mathematics classroom. [Master's thesis, Northwestern College]. NWCommons. |
AuthorMarissa McGregor, high school math teacher extraordinaire. I love my husband, daughter, and family dearly. Archives
August 2022
Categories This work is licensed under a Creative Commons Attribution-NonCommercial-ShareAlike 4.0 International License. |
 RSS Feed
