|
Last year when the world had to lock down because of the global pandemic I know a lot of teachers felt extremely overwhelmed and concerned as to how to help students engage with math digitally, and I did too, but I also love a challenge because I believe they help you grow as a person and educator. Last year I tried a lot of different technologies to help my students engage with math in a meaningful way and once I found a few I liked I stuck with those. However, after a year of playing with a bunch of different technologies - desmos, FlipGrid, PearDeck, Kami, GeoGebra, the Google suite, quizlet, blooket, etc - I now have so many tools to pick from if I want to present material in person in a new or different way. FlipGrid in particular surprised me in its usefulness in a math classroom. FlipGrid integrates with a lot of platforms, so I was easily able to link it to my google classroom, and it allows students to post short videos to share out with the entire class, or only me. I only used FlipGrid once during our virtual school year last year, in part because my first and only attempt I felt was a bit of a failure. I wanted to hear my students talking about math, so I came up with five different questions that they had to answer out loud and they could show their work on a piece of paper in the video as well. And while my students did an excellent job and it was wonderful to see and hear my students talking about math, it was a bit uninspired and overwhelming of a task for some. Since then, and after brainstorming with my amazing classmates in my MSU CEP 805 course, I have had so many new ideas for how to implement FlipGrid in the classroom and I have even put them to use a few times this year. I had my algebra 1 students create their own ‘graphing stories’ videos and then watch their classmates and graph them on paper. Feel free to use this activity that I created for my students, inspired by the website - graphingstories.com 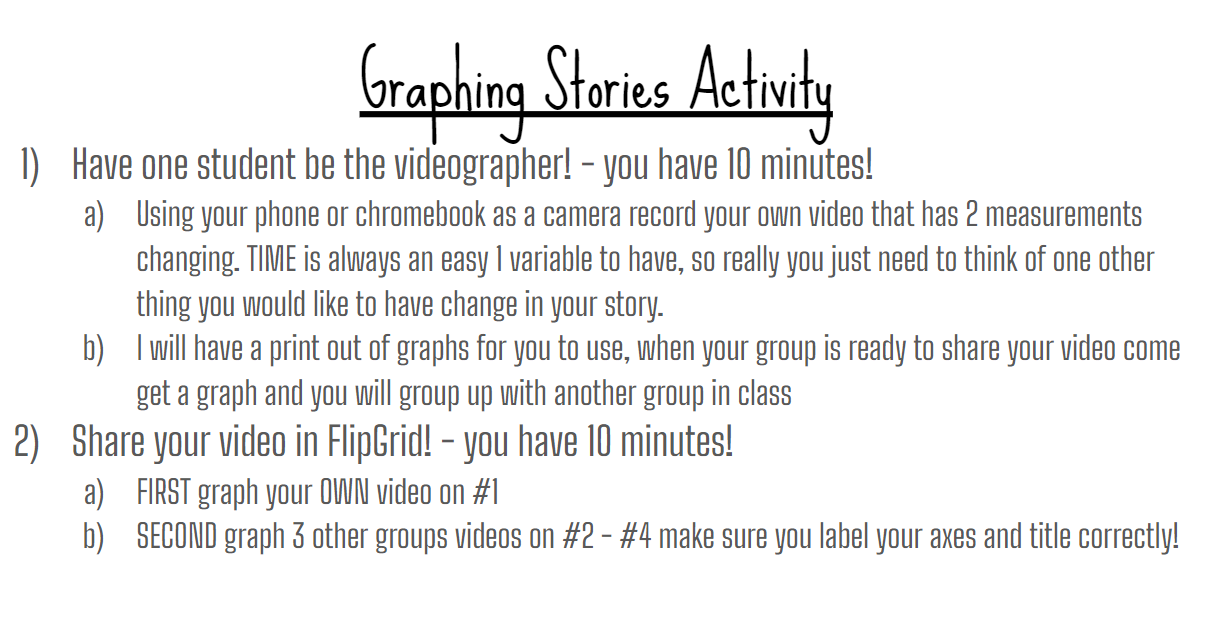 For our upcoming surface area and volume unit in geometry I will have students find objects at home to take pictures or videos of with a ruler so that we can find their measurements, or at least talk about how their measurements might be similar, different, or related. And finally a project I am working on currently for my algebra 2 students is one in which I will have them take video of rolling a pair of dice a number of times, pulling out a card from a standard deck a number of times, pulling candy out of a bag a number of times, etc. to simulate experimental probability that we can then watch everyone in class do this and find those probabilities. If you have other suggestions on how to implement FlipGrid in a math classroom, please comment below! While all these new ideas are exciting and fun to try, there is always the worry that a student may not have stable internet to do this at home, or the home life to feel safe in posting a video like this. You may have students who do not attend to the task at hand, or do not feel comfortable being on camera. Luckily building up trust in your classroom can alleviate some of these concerns and FlipGrid has emojis you can put over faces, or a blur feature if you do not want to be on camera. And luckily my school is fortunate enough to be one-to-one so each student has a Chromebook with a webcam, so as long as I provide some class time to complete the task usually it can get done. Resources:
Misura, M. (2021, October 10). Graphing Stories. [Image].
0 Comments
Leave a Reply. |
AuthorMarissa McGregor, high school math teacher extraordinaire. I love my husband, daughter, and family dearly. Archives
August 2022
Categories This work is licensed under a Creative Commons Attribution-NonCommercial-ShareAlike 4.0 International License. |
 RSS Feed
