 After a few weeks of considering how to integrate social awareness into my Data and Statistics unit for my end of the school year unit, I decided to have the unit culminate in a project. In this project, students will need to research some issue using the website Statista and then create their own survey to distribute to some of our student population to see how the data that they collect compares to that data that they have researched. The will need to display that data using multiple modes, and I also want to incorporate some big questions about what that data is telling them about the world around us.
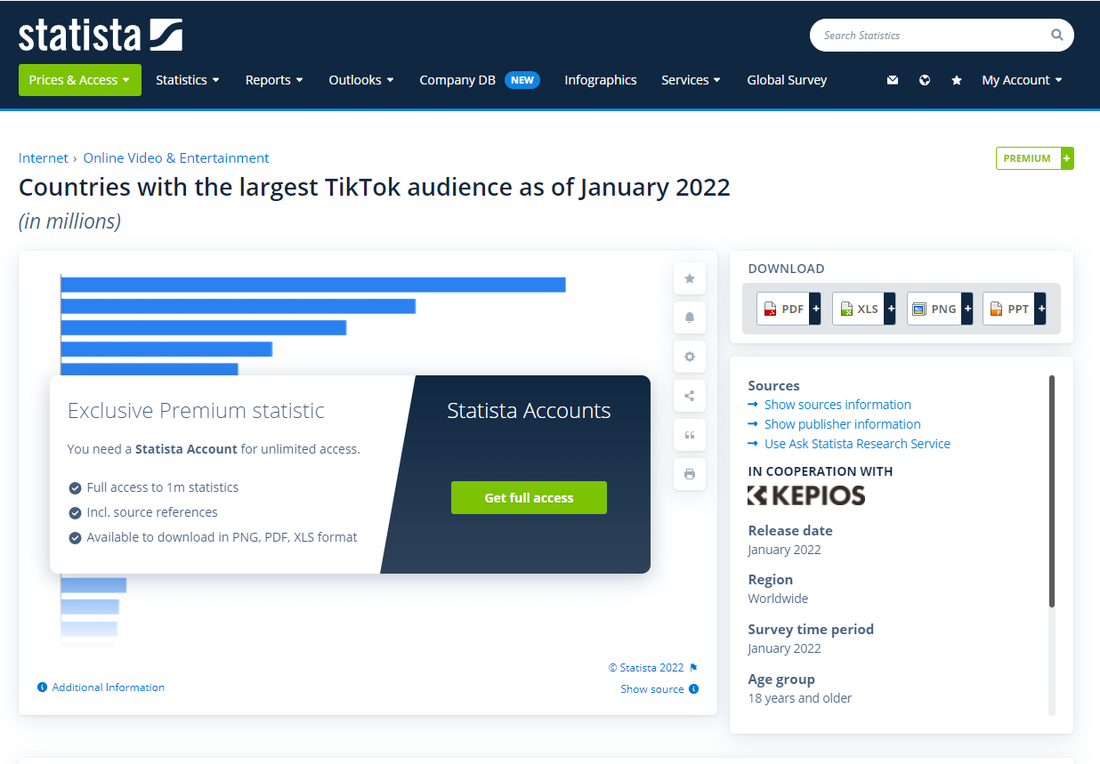
I had had an idea to do a project like this for a long time, but always struggled with the research aspect of this for myself and for my students. I think that researching a specific topic for specific data points can be a real challenge and giving students the freedom and wide-openness to do this I think would be overwhelming, so the project always sat on the back burner. However, thanks to my amazing classmates in my CEP 805 class I was introduced to the site, Statista. On their website you can search for almost any topic and find a brief overview of the topic, and then tons of different kinds of data points that you can view as line graphs, bar graphs, or get related information to that topic. I love that all of my students' research can be done in one place. That being said, one of the major downsides to Statista is that you need to sign up for an account to access the information and even after that some of the data is still behind a paywall. I haven’t decided yet if I want to ask my students to use their school email to sign up for an account because there are always privacy issues to take into account and asking students to sign up for things they aren’t comfortable with is unfair. I could simply use my login, but then I would feel like students aren’t really doing the research so there is a lot to consider. With that too, because there is so much information under one category it could be difficult for students to sift through what is important to them for their project and not. Overall I feel like perhaps the benefits outweigh the negatives here because incorporating some real world data into a mathematics project about collecting, analyzing, and displaying data in a meaningful way would be so powerful for my students to experience. Bringing math to life for them so that they see the value in what they are learning is a key factor in exciting students to learn more about that topic.
0 Comments
Leave a Reply. |
AuthorMarissa McGregor, high school math teacher extraordinaire. I love my husband, daughter, and family dearly. Archives
August 2022
Categories This work is licensed under a Creative Commons Attribution-NonCommercial-ShareAlike 4.0 International License. |
 RSS Feed
